Why Home Prices Are Increasing

Why Home Prices Are Increasing | Simplifying The Market

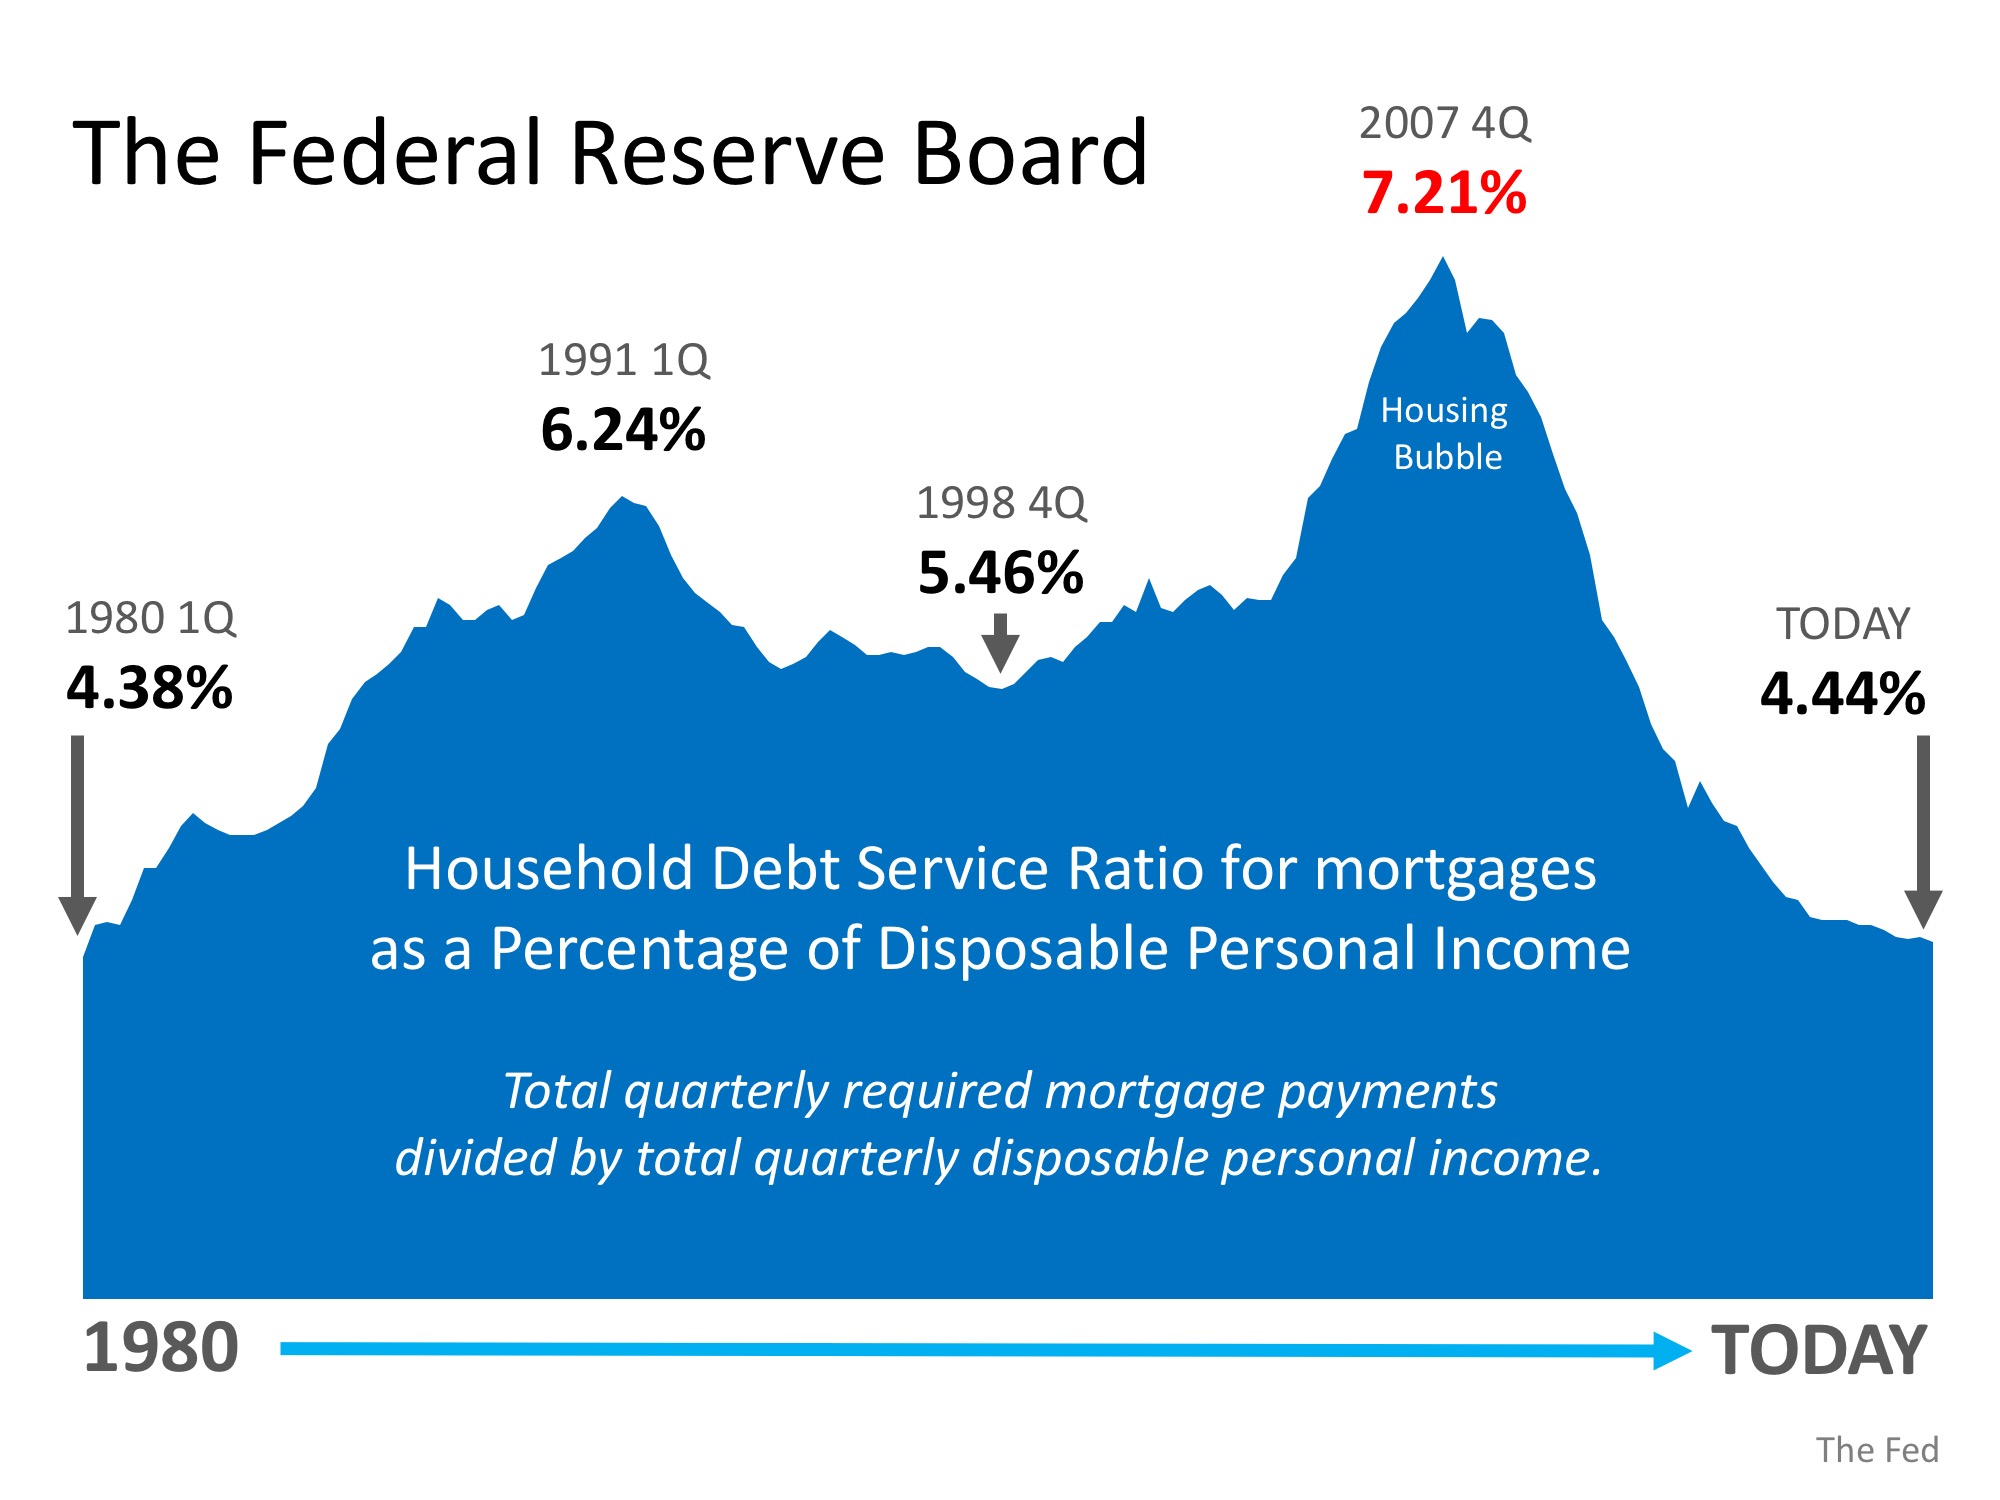
There are many unsubstantiated theories as to why home values are continuing to increase. From those who are worried that lending standards are again becoming too lenient (data shows this is untrue), to those who are concerned that prices are again approaching boom peaks because of “irrational exuberance” (this is also untrue as prices are not at peak levels when they are adjusted for inflation), there seems to be no shortage of opinion.

However, the increase in prices is easily explained by the theory of supply & demand. Whenever there is a limited supply of an item that is in high demand, prices increase.

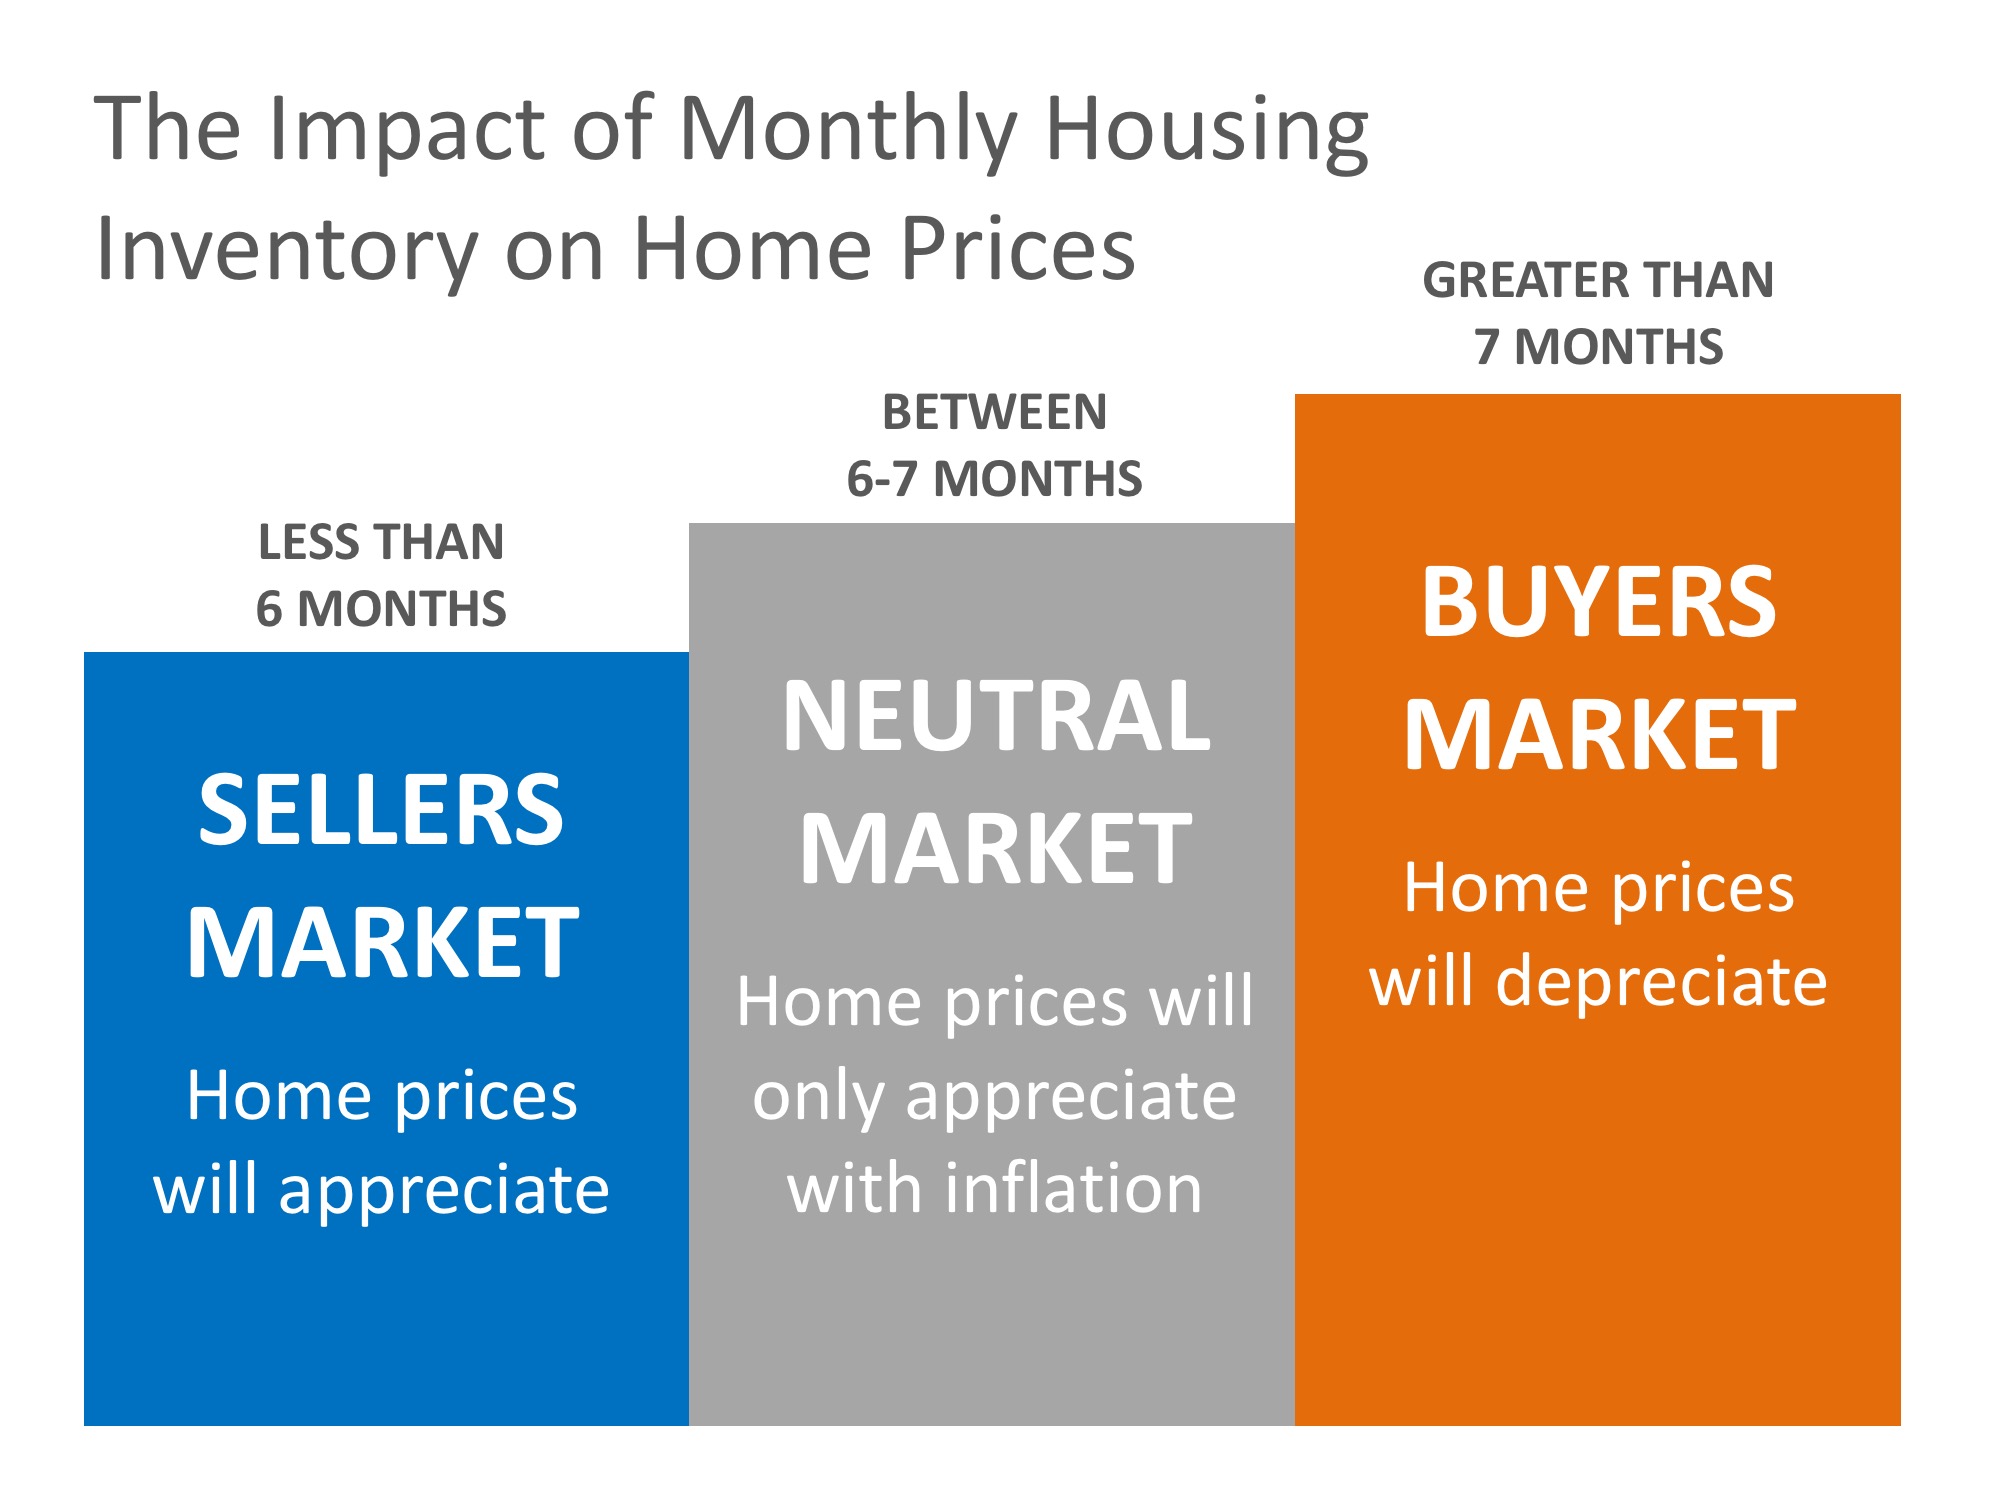
It is that simple. In real estate, it takes a six-month supply of existing salable inventory to maintain pricing stability. In most housing markets, anything less than six months will cause home values to appreciate and anything more than seven months will cause prices to depreciate (see chart below).

Why Home Prices Are Increasing | Simplifying The Market

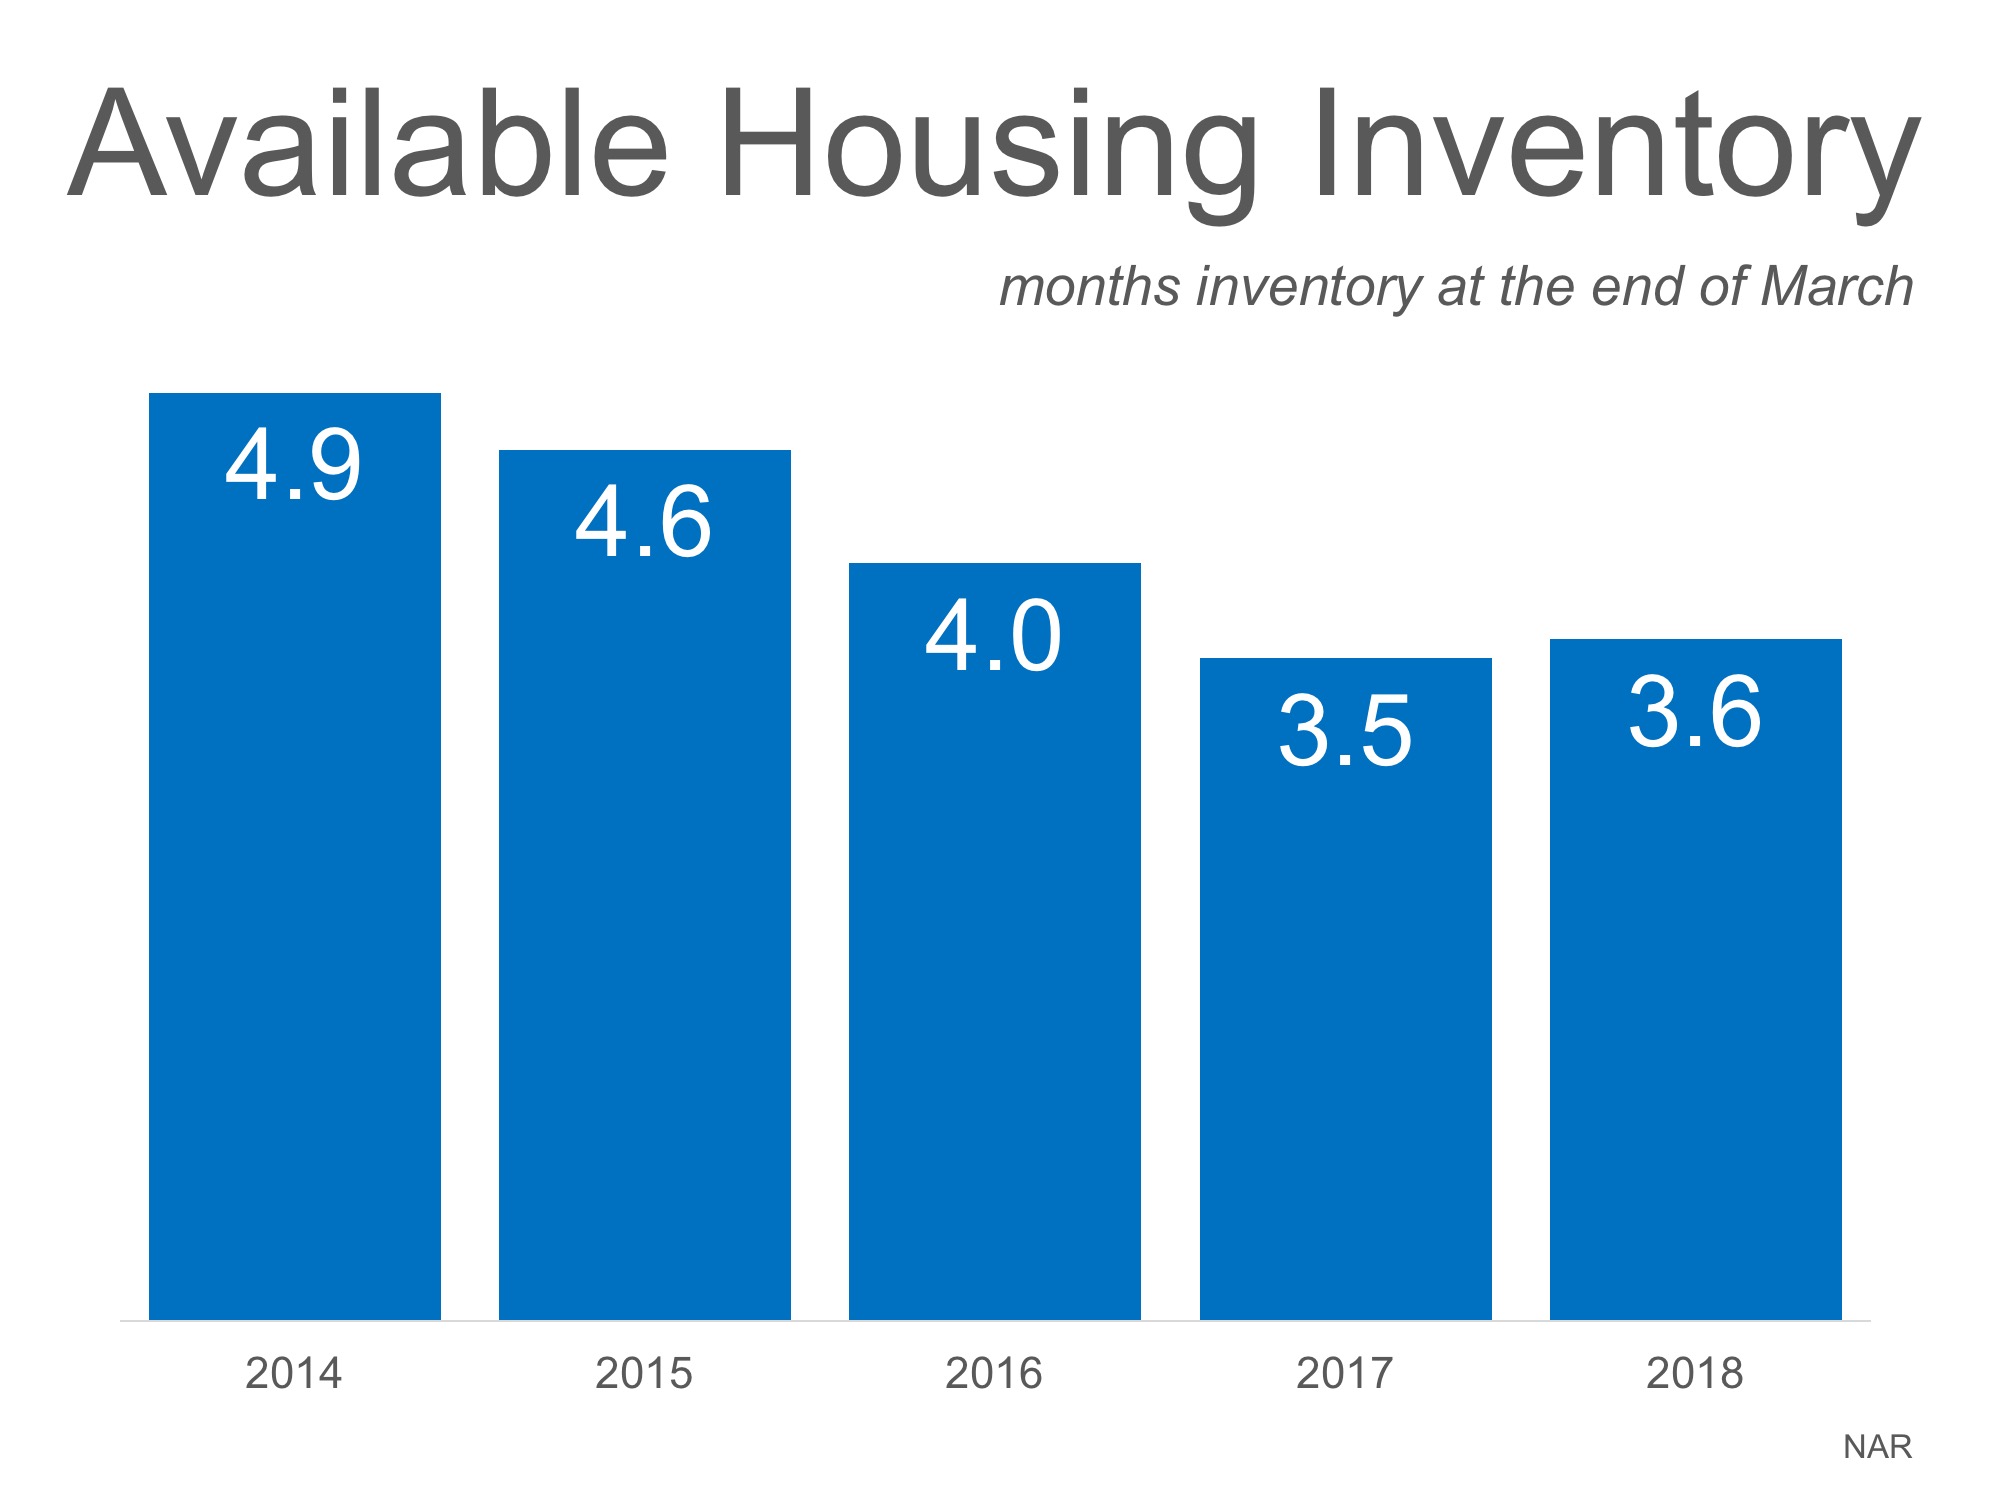
According to the Existing Home Sales Report from the National Association of Realtors (NAR), the monthly inventory of homes for sale has been below six months for the last five years (see chart below).

Why Home Prices Are Increasing | Simplifying The Market

Bottom Line

If buyer demand continues to outpace the current supply of existing homes for sale, prices will continue to appreciate. Nothing nefarious is taking place. It is simply the theory of supply & demand working as it should.

from Simplifying the Market™ https://ift.tt/2r8uUdh
via IFTTT

Existing Home Sales Grow Despite Low Inventory [INFOGRAPHIC]

Existing Home Sales Grow Despite Low Inventory [INFOGRAPHIC] | Simplifying the Market

Existing Home Sales Grow Despite Low Inventory [INFOGRAPHIC] | Simplifying the Market

Some Highlights:

  • According to the latest Existing Home Sales Report from the National Association of Realtors, sales grew 1.1% in March to an annual pace of 5.60 million.
  • This is the strongest pace since November of 2017.
  • Inventory levels dropped year-over-year for the 34th consecutive month and are now 7.2% lower than March 2017 levels, representing a 3.6-month supply.

from Simplifying the Market™ https://ift.tt/2I8koed
via IFTTT

“Short of a war or stock market crash…”

“Short of a war or stock market crash…” | Simplifying The Market

This month, Arch Mortgage Insurance released their spring Housing and Mortgage Market Review. The report explained that an increase in mortgage rates and/or home prices would impact monthly payments this way:

  • A 5% increase in home prices increases payments by roughly 5%
  • A 1% rise in interest rates increases payments by roughly 13% or 14%

That begs the question…

What if both rates and prices increase as predicted?

The report revealed:

“If interest rates and home prices rise by year-end in the ballpark of what most analysts are forecasting, monthly mortgage payments on a new home purchase could increase another 10–15%. That would make 2018 one of the worst full-year deteriorations in affordability for the past 25 years.”

The percent increase in mortgage payments would negatively impact affordability. But, how would affordability then compare to historic norms?

Per the report:

“For the U.S. overall, even if affordability were to deteriorate as forecasted, affordability would still be reasonable by historic norms. That is because the percentage of pre-tax income needed to buy a typical home in 2019 would still be similar to the historical average during 1987–2004. Thus, nationally at least, even with higher rates and home prices, affordability will just revert to historical norms.”

What about home prices?

A decrease in affordability will cause some concern about home values. Won’t an increase in mortgage payments negatively impact the housing market? The report addressed this question:

“Even recent interest rate increases and higher taxes on some upper-income earners didn’t slow the market, as many had feared…Short of a war or stock market crash, housing markets could continue to surprise on the upside over the next few years.”

To this point, Arch Mortgage Insurance also revealed their Risk Index which estimates the probability of home prices being lower in two years. The index is based on factors such as regional unemployment rates, affordability, net migration, housing starts and the percentage of delinquent mortgages.

Below is a map depicting their projections (the darker the blue, the lower the probability of a price decrease):

“Short of a war or stock market crash…” | Simplifying The Market

Bottom Line

If interest rates and prices continue to rise as projected, the monthly mortgage payment on a home purchased a year from now will be dramatically more expensive than it would be today.

from Simplifying the Market™ https://ift.tt/2KdDboO
via IFTTT

New Study Shows ‘Best States for Millennials’

New Study Shows ‘Best States for Millennials’ | Simplifying The Market

A new study by WalletHub used “30 key metrics, ranging from share of millennials to millennial unemployment rate to millennial voter-turnout rate” to find out which states are the ‘Best States for Millennials.’

The Top 5 Best States for Millennials are:

  1. Washington, D.C. (also ranks highest in percentage of millennials already living there!)
  2. North Dakota (lowest unemployment rate)
  3. Minnesota (highest millennial homeownership rate)
  4. Massachusetts (highest percentage of millennials with health insurance coverage)
  5. Iowa (ranked #1 in lowest housing cost for millennials)

Below is a map with the rankings for each of the 50 states:

New Study Shows ‘Best States for Millennials’ | Simplifying The Market

We recently reported on a study that set out to find out “How Much You Need to Make to Buy a Home in Your State,” which may have left you wondering what the average salaries are in each of the five states listed above.

According to WalletHub’s research, the top 5 states with the Highest Average Millennial Salaries are:

  1. Washington, D.C.
  2. New York
  3. Massachusetts
  4. Washington
  5. California

Every day, more and more millennials are aging into the ‘Responsibility Zone,’ the time in their lives when their responsibilities start to dictate their behaviors. For many, this includes buying a home. The top 5 states with the Highest Millennial Homeownership Rate are:

  1. Minnesota
  2. West Virginia
  3. Indiana
  4. Utah
  5. Delaware

Bottom Line

If owning a home is next on your list, let’s get together to answer any questions you may have and set you on the path to homeownership!

from Simplifying the Market™ https://ift.tt/2JnevJo
via IFTTT

Thinking of Selling Your Home? Why You Need A Pro in Your Corner

Thinking of Selling Your Home? Why You Need A Pro in Your Corner | Simplifying The Market

With home prices on the rise and buyer demand strong, some sellers may be tempted to try and sell their homes on their own (FSBO) without using the services of a real estate professional.

Real estate agents are trained and experienced in negotiation and, in most cases, the seller is not. Sellers must realize that their ability to negotiate will determine whether or not they get the best deal for themselves and their families.

Here is a list of some of the people with whom the seller must be prepared to negotiate if they decide to FSBO:

  • The buyer who wants the best deal possible
  • The buyer’s agent who solely represents the best interest of the buyer
  • The buyer’s attorney (in some parts of the country)
  • The home inspection companies, which work for the buyer and will almost always find some problems with the house
  • The termite company if there are challenges
  • The buyer’s lender if the structure of the mortgage requires the sellers’ participation
  • The appraiser if there is a question of value
  • The title company if there are challenges with certificates of occupancy (CO) or other permits
  • The town or municipality if you need to get the CO permits mentioned above
  • The buyer’s buyer in case there are challenges with the house your buyer is selling
  • Your bank in the case of a short sale

Bottom Line

The percentage of sellers who have hired real estate agents to sell their homes has increased steadily over the last 20 years. Let’s get together and discuss all we can do to make the process easier for you.

from Simplifying the Market™ https://ift.tt/2vJ5us6
via IFTTT

Buying a Home Is Cheaper Than Renting in the Majority of the US

Buying a Home Is Cheaper Than Renting in the Majority of the US | Simplifying The Market

The results of the 2018 Rental Affordability Report from ATTOM show that buying a median-priced home is more affordable than renting a three-bedroom property in 54% of U.S. counties analyzed for the report.

The updated numbers show that renting a three-bedroom property in the United States requires an average of 38.8% of income.

The least affordable market for renting was Marin County, CA, just over the Golden Gate Bridge from San Francisco, where renters spend a staggering 79.5% of average wages on rent, while the most affordable market was Madison County, AL where 22.3% of average wages went to rent.

Other interesting findings in the report include:

  • Average rent rose faster than income in 60% of counties
  • Average rent rose faster than median home prices in 41% of counties
  • While median home prices rose faster than average rents in 58% of counties

Bottom Line

Buying a home makes sense socially and financially. If you are one of the many renters out there who would like to evaluate your ability to buy this year, let’s get together to find your dream home.

from Simplifying the Market™ https://ift.tt/2HF396p
via IFTTT

Home Buying Myths Slayed [INFOGRAPHIC]

Home Buying Myths Slayed [INFOGRAPHIC] | Simplifying the Market

Home Buying Myths Slayed [INFOGRAPHIC] | Simplifying the Market

Some Highlights:

  • The average down payment for first-time homebuyers is only 6%!
  • Despite mortgage interest rates being over 4%, rates are still below historic numbers.
  • 88% of property managers raised their rents in the last 12 months!
  • The credit score requirements for mortgage approval continue to fall.

from Simplifying the Market™ https://ift.tt/2qMluDU
via IFTTT

Is Family Mortgage Debt Out of Control?

Is Family Mortgage Debt Out of Control? | Simplifying The Market

Some homeowners have recently done a “cash out” refinance and have taken a portion of their increased equity from their house. Others have sold their homes and purchased more expensive homes with larger mortgages. At the same time, first-time buyers have become homeowners and now have mortgage payments for the first time.

These developments have caused concern that families might be reaching unsustainable levels of mortgage debt. Some are worried that we may be repeating a behavior that helped precipitate the housing crash ten years ago.

Today, we want to assure everyone that this is not the case. Here is a graph created from data released by the Federal Reserve Board which shows the Household Debt Service Ratio for mortgages as a percentage of disposable personal income. The ratio is the total quarterly required mortgage payments divided by total quarterly disposable personal income. In other words, the percentage of spendable income people are using to pay their mortgage.

Is Family Mortgage Debt Out of Control? | Simplifying The Market

Today’s ratio of 4.44% is nowhere near the ratio of 7.21% during the peak of the housing bubble and is instead at the lowest rate since 1980 (4.38%).

Bill McBride of Calculated Risk recently commented on the ratio:

“The Debt Service Ratio for mortgages is near the low for the last 38 years. This ratio increased rapidly during the housing bubble and continued to increase until 2007. With falling interest rates, and less mortgage debt, the mortgage ratio has declined significantly.”

Bottom Line

Many families paid a heavy price because of questionable practices that led to last decade’s housing crash. It seems the American people have learned a lesson and are not repeating that same behavior regarding their mortgage debt.

from Simplifying the Market™ https://ift.tt/2vx8FTK
via IFTTT

How Much Do You Need to Make to Buy a Home in Your State?

How Much Do You Need to Make to Buy a Home in Your State? | Simplifying The Market

It’s no mystery that cost of living varies drastically depending on where you live, so a new study by GOBankingRates set out to find out what minimum salary you would need to make in order to buy a median-priced home in each of the 50 states, and Washington, D.C.

States in the Midwest came out on top as most affordable, requiring the smallest salaries in order to buy a median-priced home. States with large metropolitan areas saw a bump in the average salary needed to buy with California, Washington, D.C., and Hawaii edging out all others with the highest salaries required.

Below is a map with the full results of the study:

How Much Do You Need to Make to Buy a Home in Your State? | Simplifying The Market

GoBankingRates gave this advice to anyone considering a home purchase,

“Before you buy a home, it’s important to find out if you can afford the monthly mortgage payment. To do this, some financial experts recommend your housing costs — primarily your mortgage payments — shouldn’t consume more than 30 percent of your monthly income.”

As we recently reported, research from Zillow shows that historically, Americans had spent 21% of their income on owning a median-priced home. The latest data from the fourth quarter of 2017 shows that the percentage of income needed today is only 15.7%!

Bottom Line

If you are considering buying a home, whether it’s your first time or your fifth time, let’s get together to evaluate your ability to do so in today’s market!

from Simplifying the Market™ https://ift.tt/2JSMAlA
via IFTTT

Rising Prices Help You Build Your Family’s Wealth

Rising Prices Help You Build Your Family’s Wealth | Simplifying The Market

Over the next five years, home prices are expected to appreciate, on average, by 3.6% per year and to grow by 18.2% cumulatively, according to Pulsenomics’ most recent Home Price Expectation Survey.

So, what does this mean for homeowners and their equity position?

As an example, let’s assume a young couple purchased and closed on a $250,000 home this January. If we only look at the projected increase in the price of that home, how much equity will they earn over the next 5 years?

Rising Prices Help You Build Your Family’s Wealth | Simplifying The Market

Since the experts predict that home prices will increase by 5.0% in 2018, the young homeowners will have gained $12,500 in equity in just one year.

Over a five-year period, their equity will increase by over $48,000! This figure does not even take into account their monthly principal mortgage payments. In many cases, home equity is one of the largest portions of a family’s overall net worth.

Bottom Line

Not only is homeownership something to be proud of, but it also offers you and your family the ability to build equity you can borrow against in the future. If you are ready and willing to buy, find out if you are able to today!

from Simplifying the Market™ https://ift.tt/2JQ2XiK
via IFTTT